John D. Rockefeller Jr. Library
The research center of the Colonial Williamsburg Foundation, the John D. Rockefeller Jr. Library advances knowledge of colonial British America, the American Revolution, the early United States, American decorative arts and folk art, and the Restoration and continuing story of Colonial Williamsburg.
Learn More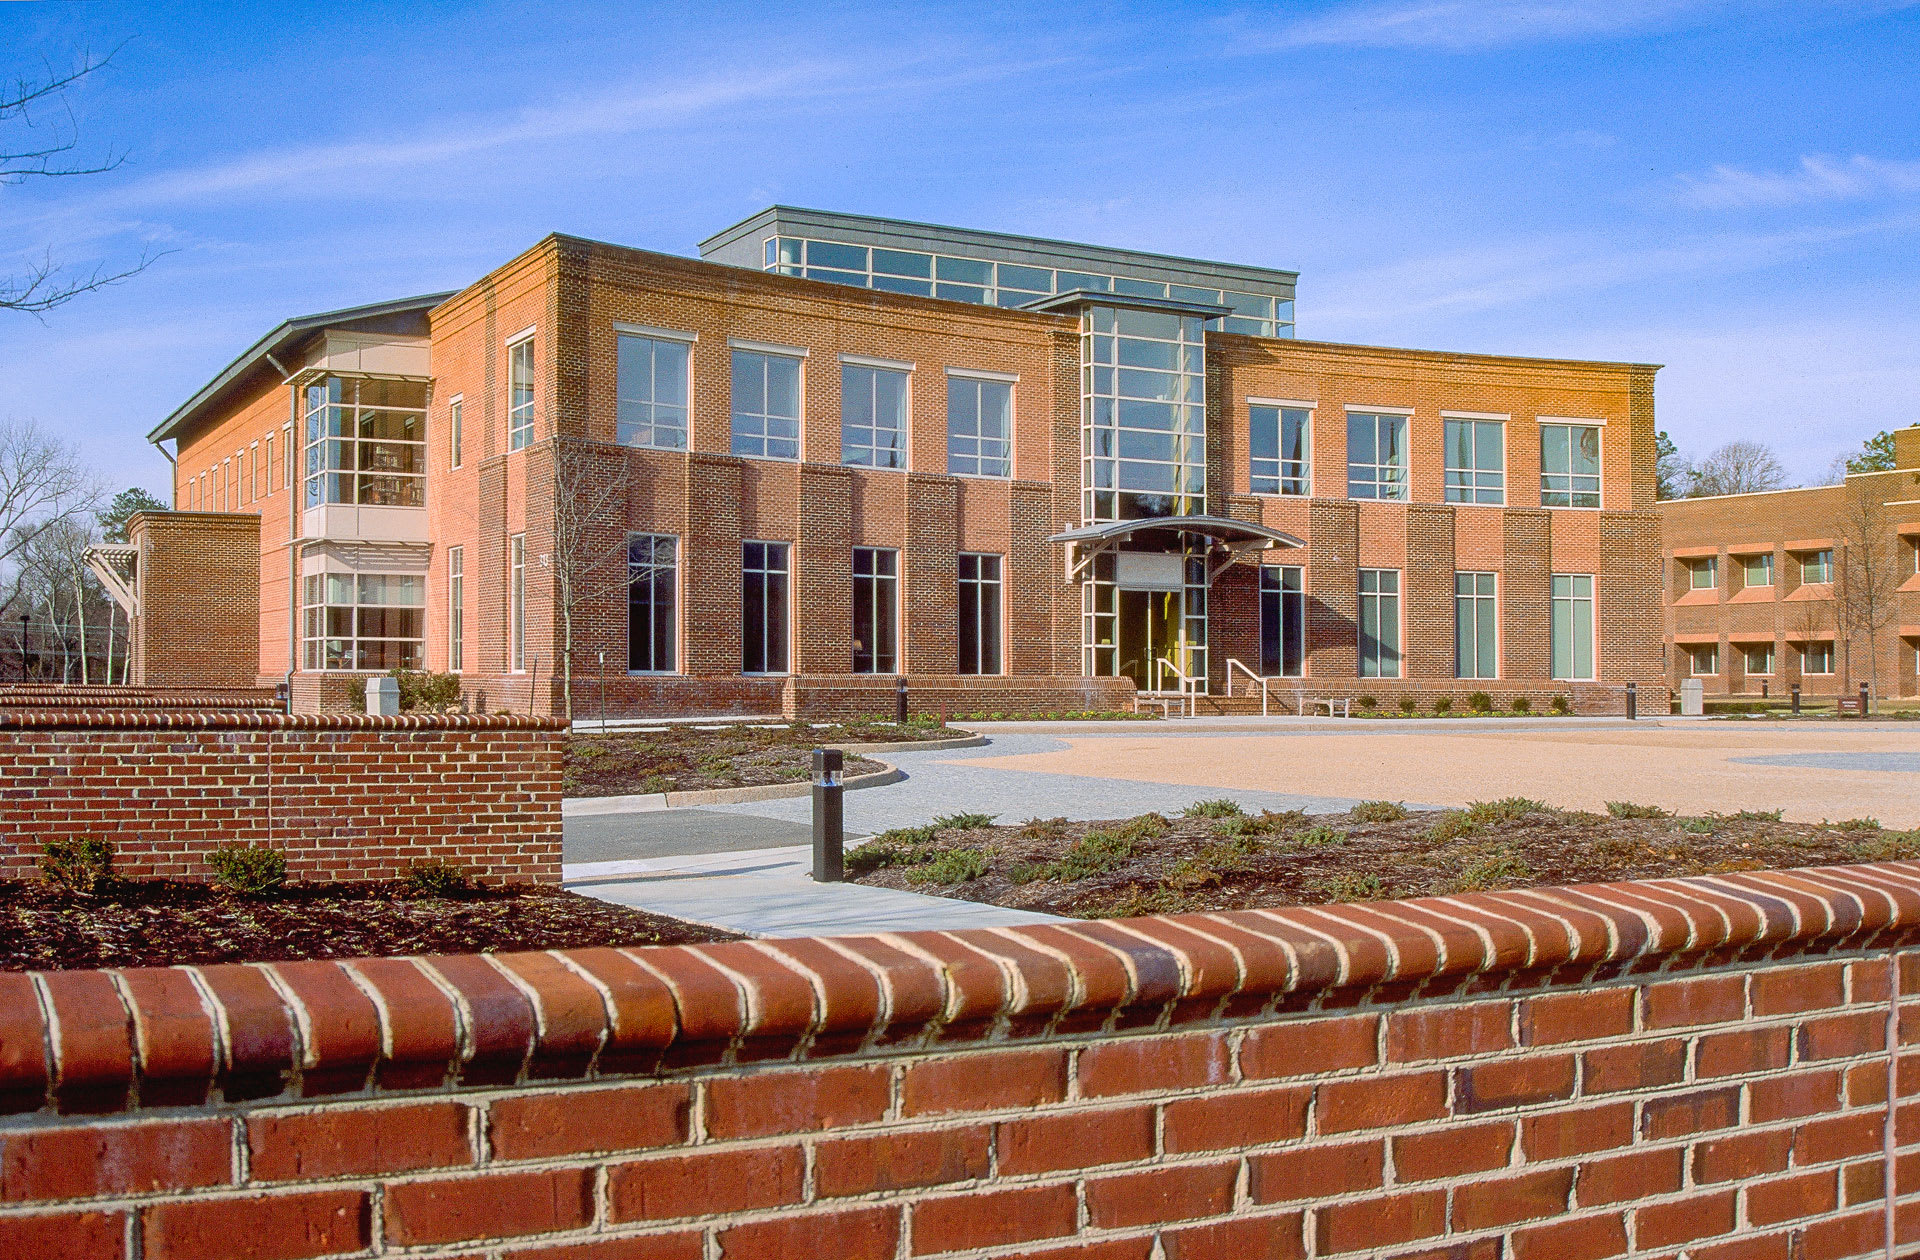
Ben Franklin's World
Colonial Williamsburg is proud to produce Ben Franklin’s World, a podcast about early American history. This award-winning and popular history podcast is for people who want to know more about the historical people and events that have impacted and shaped our present-day world.
Learn More
Preservation
Interactive Timelines
Virtual Education
Publications
CW Kids

Art Museums for CW Kids
Explore items from the Art Museums of Colonial Williamsburg's collection. Learn cool facts, have some fun with at-home craft projects, and find out where to see these items in person when you visit!